26 Mar 2025
Company Spotlight
Don’t invest unless you’re prepared to lose all the money you invest. This is a high-risk investment and you are unlikely to be protected if something goes wrong. Take 2 mins to learn more
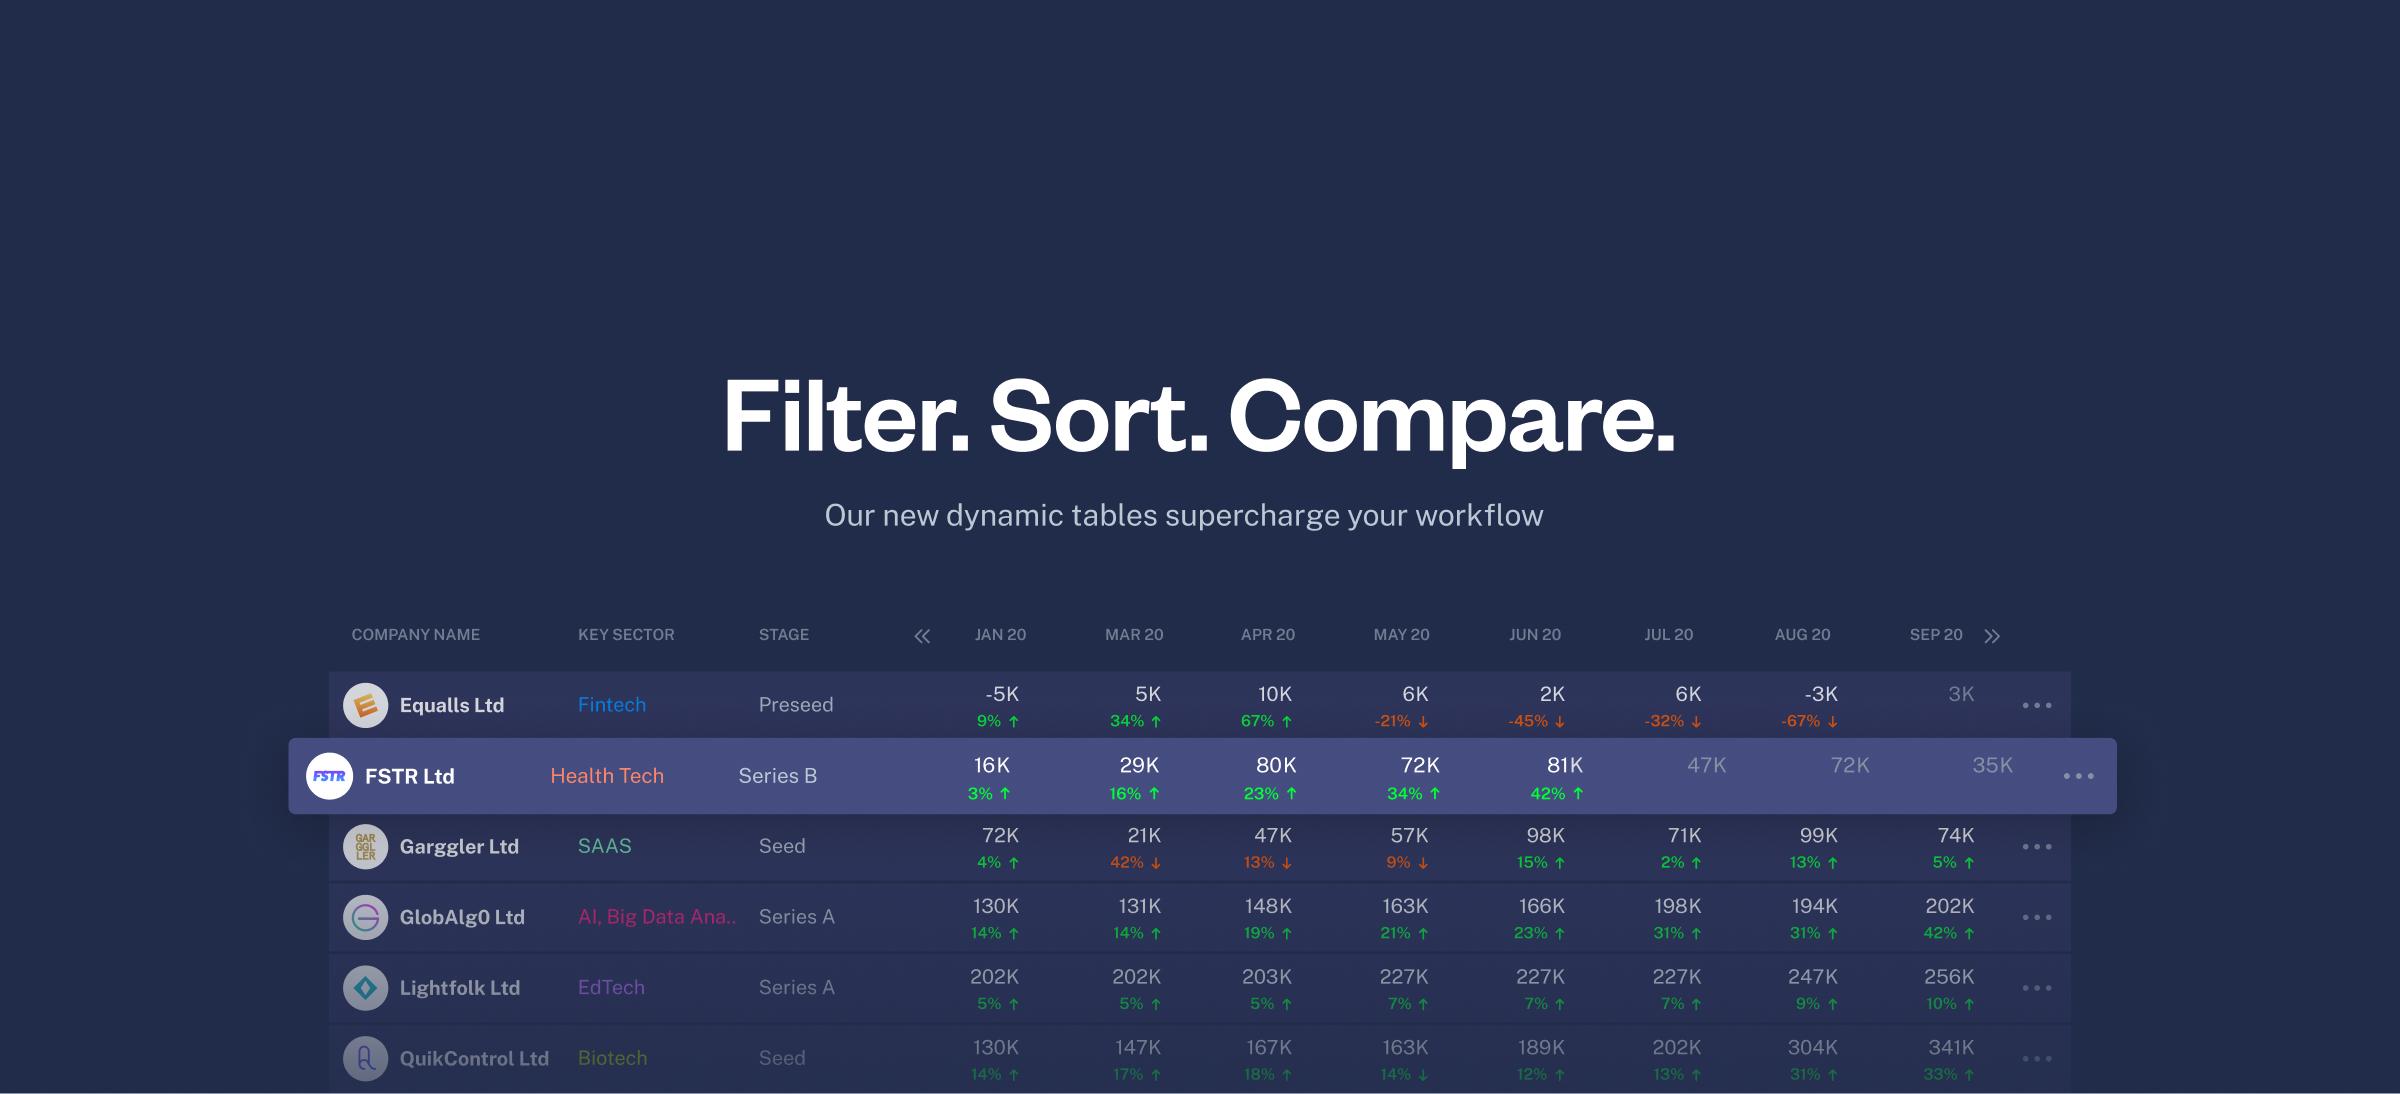
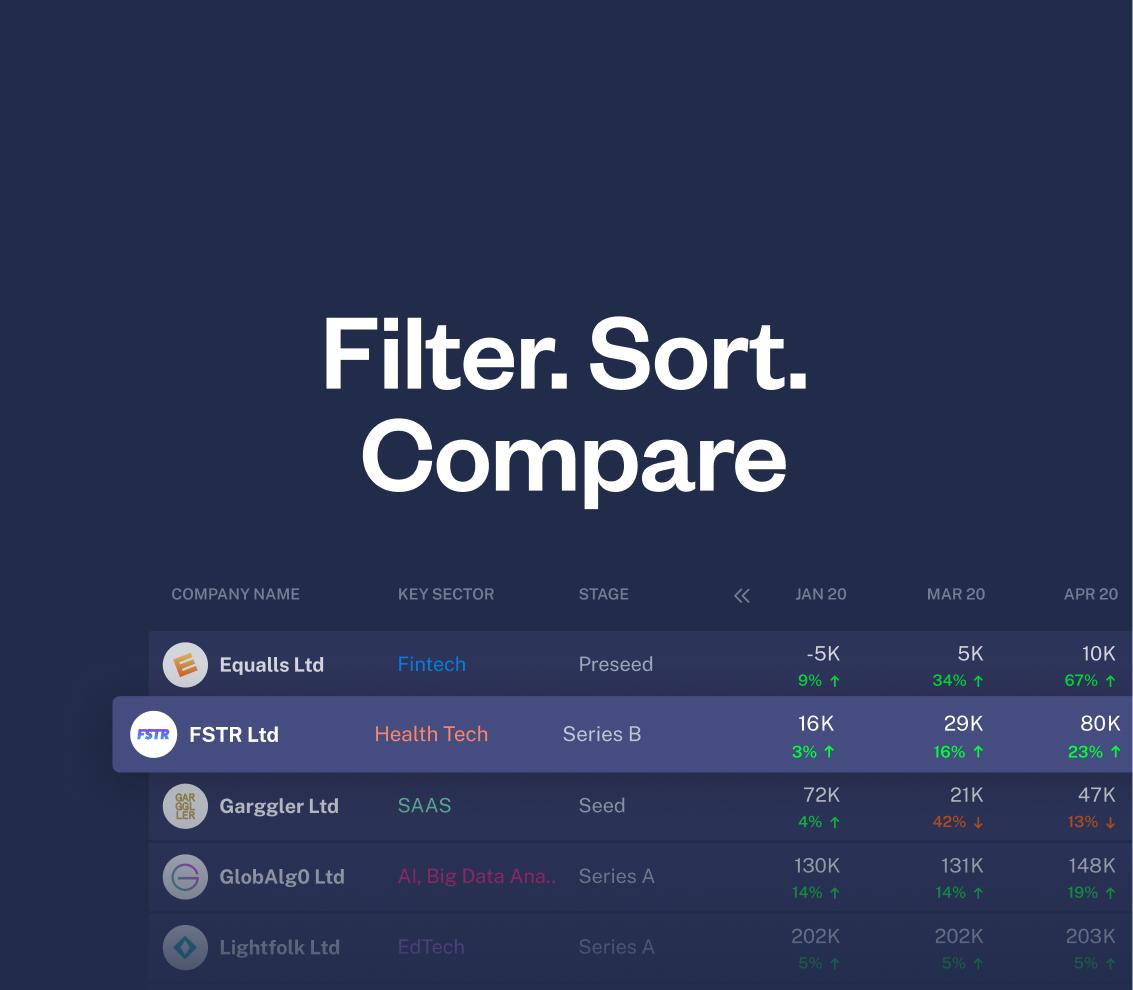
Keeping track of your investment portfolio has never been easier with our innovative, new Analysis Tables. This brand new feature enables investment teams to filter, sort and compare Key Performance Indicators (KPIs) with ease!
The new and improved command bar gives you the power to filter your portfolio data by Sector, Company Location, Funding Stage and KPIs in either Table, Graph or Card view. Example: United Kingdom, FinTech, Series A, Gross Profit
Simply sort your portfolio data by column headers. Once you are within Table View, simply tap on the column you wish to sort to see your investment data in order of least to greatest.
Once the analysis table have been populated with the data you need, you now have the ability sort the data columns to easily identify which company is outperforming their forecasts, or more importantly who might need a closer eye.
Importing your investments is as easy as Drag and Drop. Simply forward your data to [email protected], your data is then processed and checked by our in-house accountants to ensure accurate and reliable data is imported. Learn more about our Data Processing for VC’s.